OVERVIEW
This document shows how to create a Sales report by Vendor, Item and Quantity sorted on Quantity IN OLAP Sales Analysis. It can be used to help create other reports in OLAP as well.
PROCEDURE
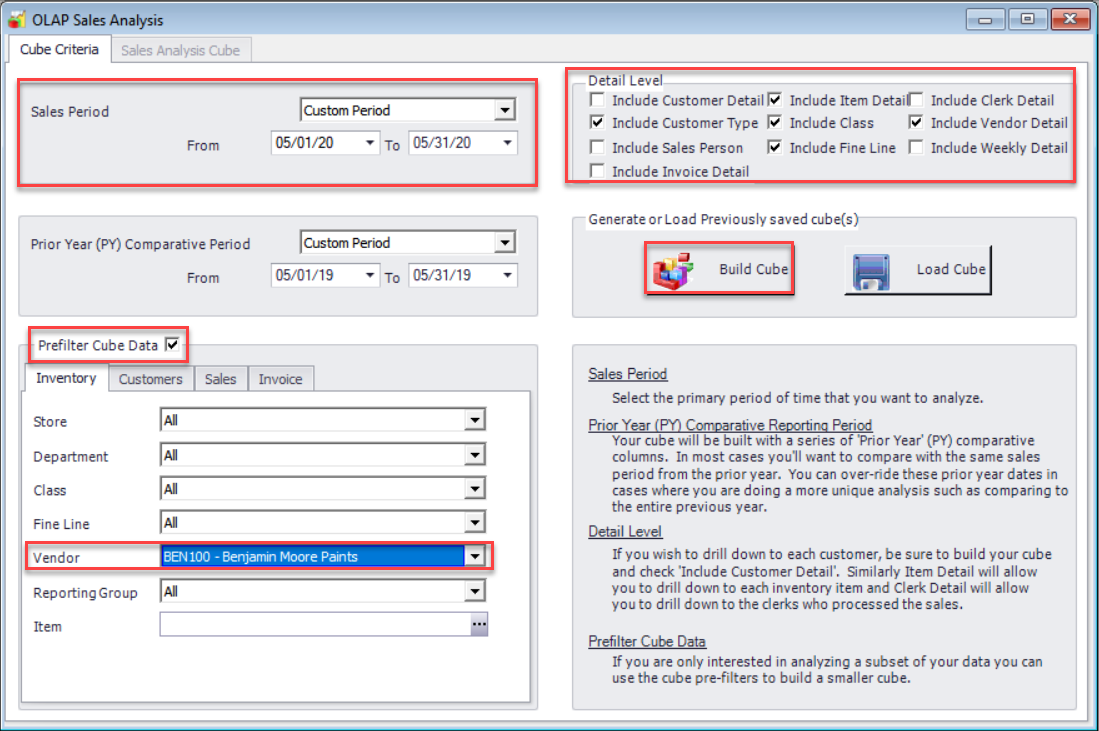
OLAP reports function by creating cubes from specific criteria. To do this go to Reports menu then select OLAP Sales Analysis. In the Cube Criteria area specify the Sales Period that is to be reported on (example 5/1/2020 through 5/31/2020). Optionally data can be pre filtered, for example click the Prefilter Cube Data checkbox and under the Inventory tab pick a vendor. Regardless of if there is any prefiltering or not the next step is to specify the detail level to be included. To do so check the desired check boxes under the Detail Level area of OLAP screen. For this report Include Item Detail and Include Vendor Detail will be used. Once happy with selections click the Build Cube button.
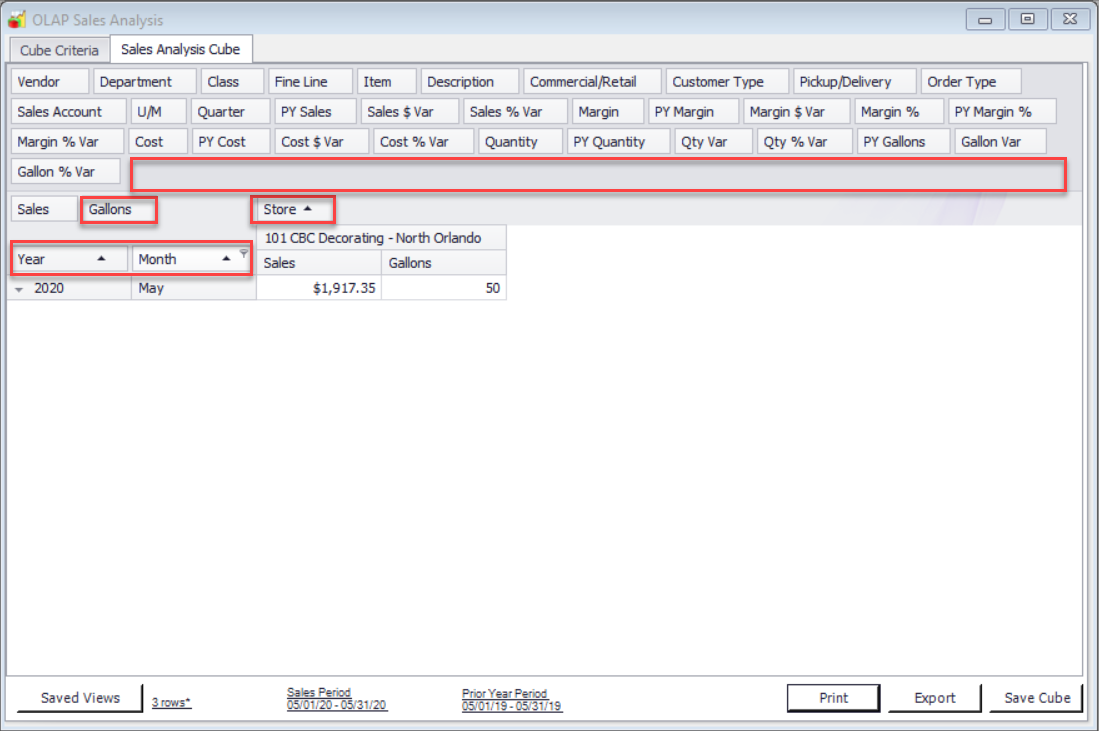
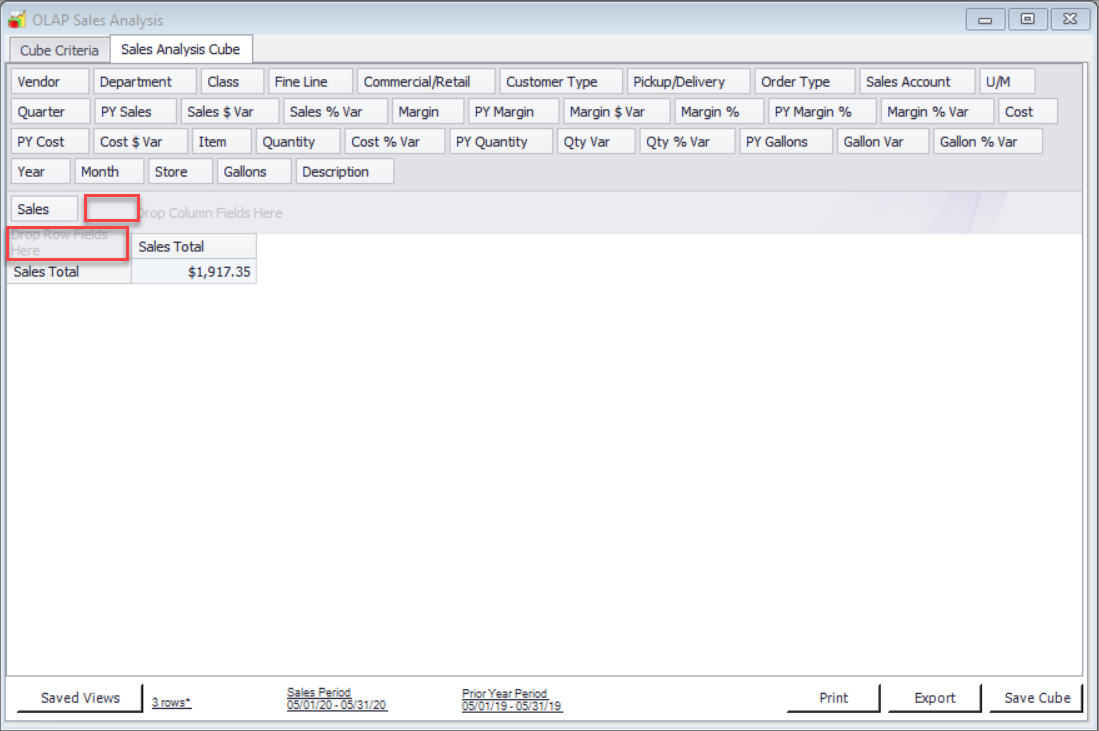
After clicking the Build Cube button then Sales Analysis Cube tab will open. In this screen data options can be dragged around to different areas to provide different data layouts. For the purposes of the report we are building we will remove the Store, Liters or Gallons,Year, Month by dragging them back to the top of the screen where other boxes are displayed.
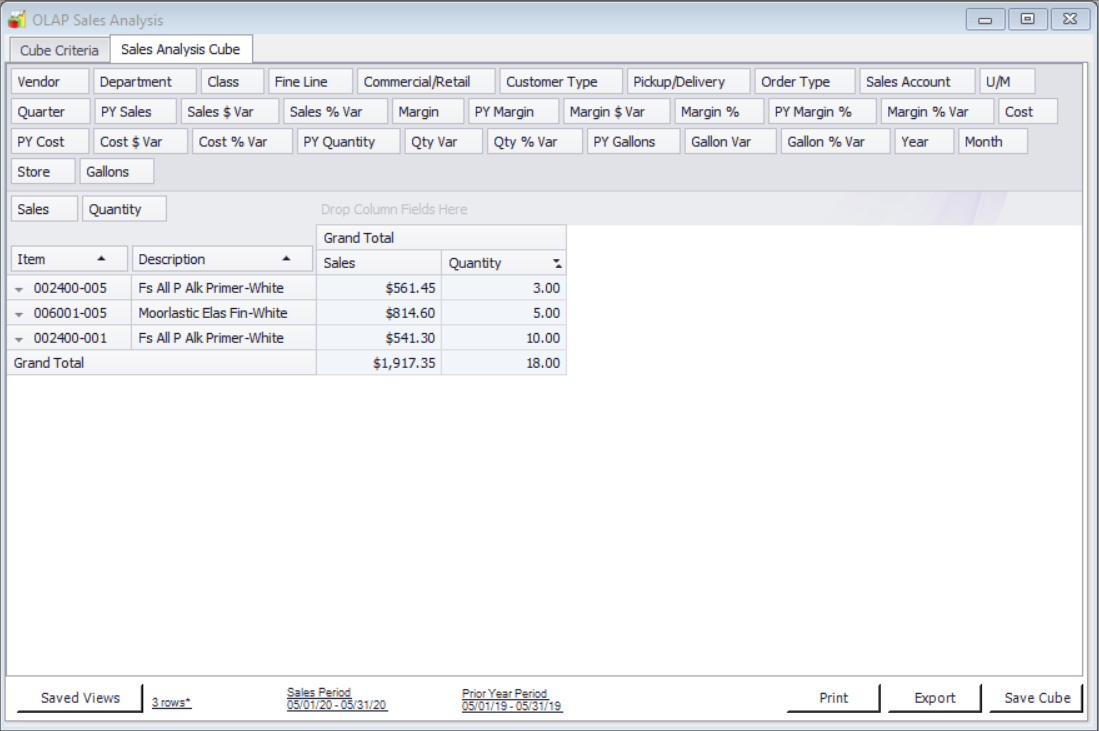
Next lets add the columns needed for this report. Start by dragging Quantity box beside the Sales box. Then drag Item and Description directly below Sales and Quantity boxes.
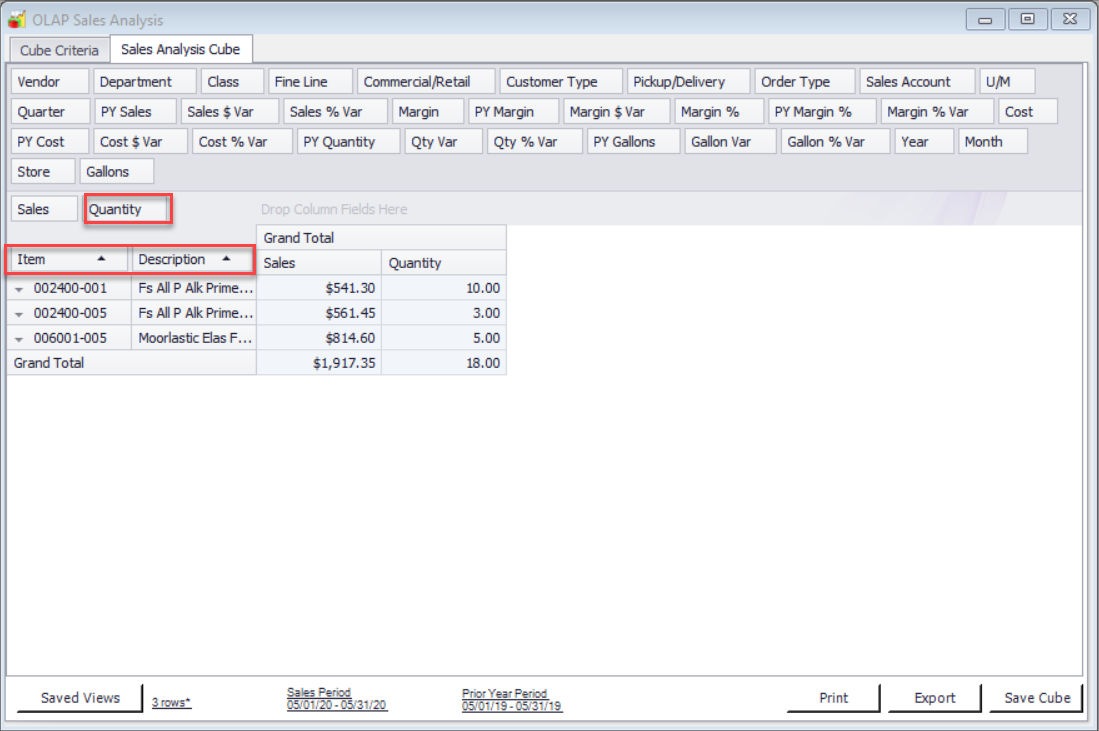
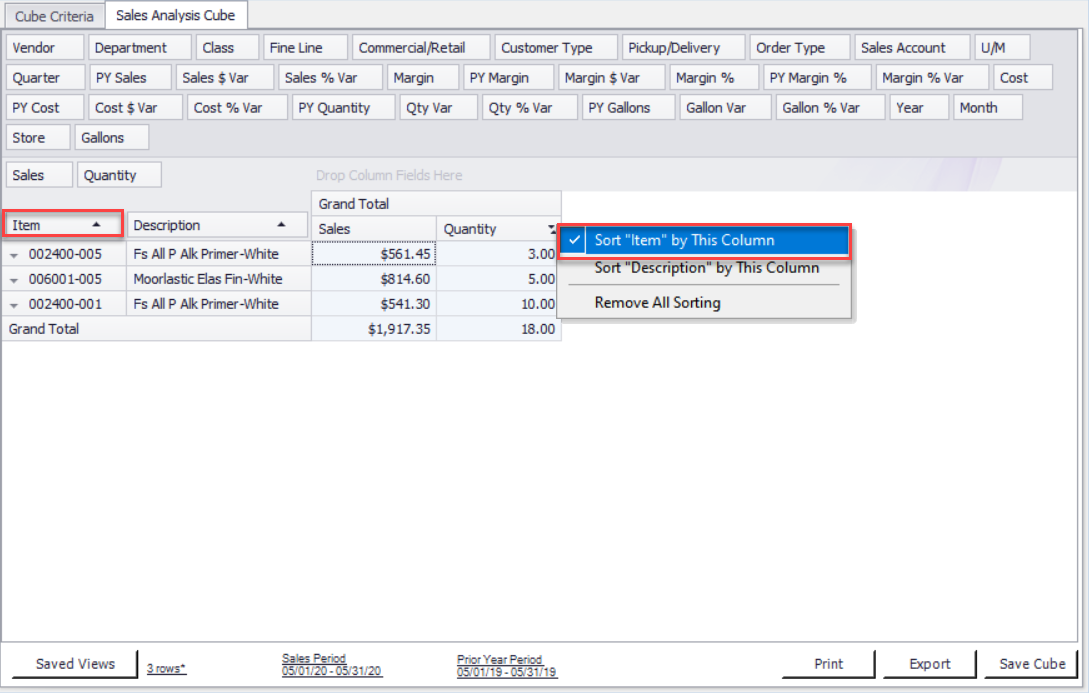
If sorting is required on Quantity or Sales Columns do the following. Right click on Quantity column and select Sort “Item” by This Column. Two little arrows pointing to each other will show on the right hand side of the Quantity column. This indicates that Quantity column will get resorted (Highest to Lowest or Lowest to Highest values) when Item column is clicked.Now click on Item column to sort Quantity figure.
To print this grid press the Print button.
Saving the View for future
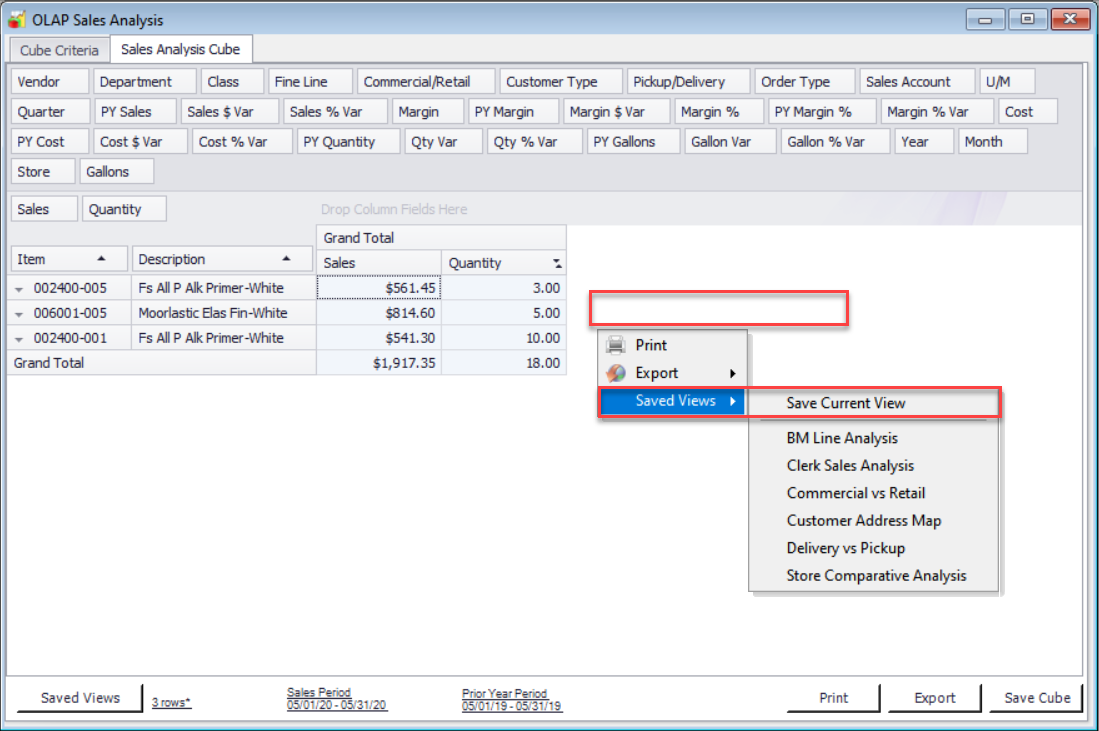
In order to save a view and re-use this data sorting for future criteria, right click in the middle of the body of the Cube grid and select Saved Views then select Save Current View.
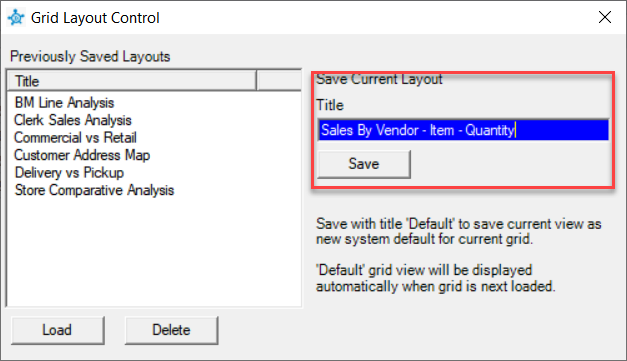
Grid Layout Control form will open. Under Title type in Sales by Vendor - Item – Quantity and click Save button. Click OK button again to confirm.
Next time pre select all the data and without moving the boxes right click in the middle of the Cube and select Save View then select Sale by Vendor – Item – Quantity view. Cube will be reformatted.
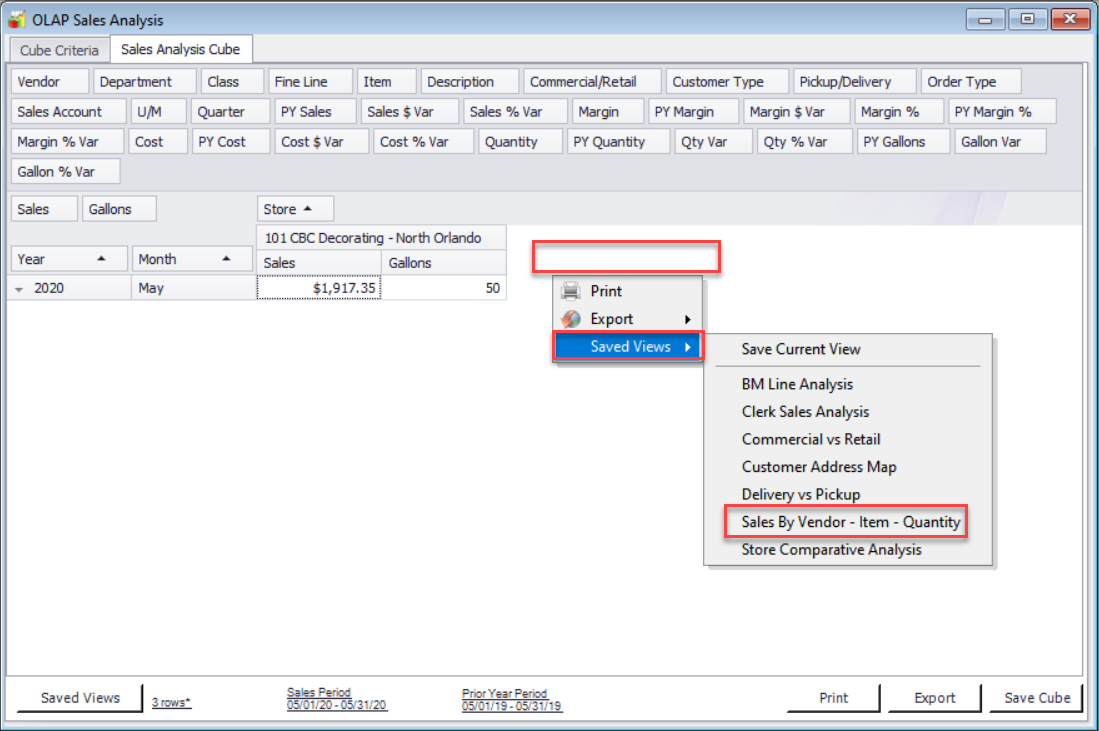
Date should be displayed like this now.
To print this grid press the Print button.